Tuesday 28 April 2015

Deleting a trace when digitizing on an image in arcmap 10.2?


Question- How do i delete a trace i did mistakenly when am digitizing layers in arcmap?

Options for ArcMap 10.2
To delete while tracing, simply go to the icons on the menu bar and look for the undo button. Click on the 'undo' button and the trace will return to the last point before the mistake.
To delete the whole sketch, then stop and save edits, right click on the layer > open attribute table. locate the sketch on the attribute table, select it and delete.

Options for QGIS
In QGIS, you will have to delete the whole sketch by right clicking and select cancel in the entry box that pops up. secondly, you can right click the layer>open attribute table>select the sketch and click the bin icon to delete it.

Monday 27 April 2015

A week break for the field


We, the folks at mapsnigeriainitiative, would like to thank all our viewers for their patronage in the last few weeks. We hope you are enjoying our content and  remain  grateful for all the views, comments and feedback we have received thus far.
We are taking a week off serious blogging as we head out field mapping later this morning. We promise to be back on Sunday with fresh content, newer techniques and great posts for you all. For the mean time, we will still be available online posting replies to comments and feedback.

Keep practicing and let the comments and feedback flowing in .

Watch out for our new page – announcements and offers. We are working towards posting it up soon.

Happy blogging

Sunday 26 April 2015

Querying the attribute tables of feature layers using ArcMap 10.2


Overview                                           Video presentation link
Querying or filtering attribute data in a GIS is technically one of the important parts of using a GIS. Fields contain several kinds of values that are linked to a spatial object. In order to get specific information from these data fields, a selection or query is applied.

Task
Our task in this post is to show you how to Select by Attributes using ArcMap 10.2. By this we mean how to query your attribute tables for particular information on them. We have a point layer consisting of some buildings represented as points. We want to query the attribute table to know which buildings are in a bad repair state and are blue in colour.

Procedure

1. Right Click on the layer > open attribute table.
bn
2. Observe the attribute table contains data of the results of a building state of repair survey. We want to know which point satisfies a selection criteria on this table. Criteria - The Repair_ State is bad and Building_col is blue
hj
3. On the main menu, Click Selection>Select by Attributes.
fgi
4. The Select by Attributes dialog box will come up. In this box, we will select the field where the unique values we are querying for lies. We make a common sql statement to execute the query. In green box are the fields we are querying and the unique values are ‘bad’ and ‘blue’(see red box)
ffg2

5. Right Click on the layer>open attribute table. The point(s) that have the attributes that meet the criteria of the selection will be highlighted on the attribute table.(highlighted in blue)
ffg3

Video presentation link
Hope you are already getting some practice. Feel free to send your comments.

Saturday 25 April 2015

Querying the attribute table of a feature layer in QGIS

Overview of the task

In our earlier post we showed you how to join attribute data tables in a GIS using ArcMap 10.2.
For today’s exercise, we will be working with attribute data in QGIS and making a Selection by Attributes. Our data comprises a spatial layer of different point features digitized on a paper map of Ibadan municipality. These point features comprise of schools, churches and hospitals. A building repair survey was done in the area by the local authorities and we have section of that in a csv table – Building Repair Survey.

Task
  • Join the attribute data to the spatial layer. (In QGIS, we had to invent a runaround way by exporting the shape file out as csv, populating it in excel and returning back as a csv/shape file to QGIS).
  • Select on the map which point features where building color is blue.
Procedure
  1. Digitize the point features (places shape file) on the raster image. Right click on the layer and Save as
1
2. A Save vector dialog box will pop up. Change Format to CSV and save in your working folder under places.csv. Make sure you uncheck Add saved file to map.

2

Snippet of the Building Repair survey csv table. We are bringing in details to the places.csv file.In excel,  copy out the attribute column and rows from the building repair survey table and paste into the places.csv sheet.
3

3. When you paste the places.csv will look like this. The pasted contents are to the right beginning from column C.
4
  1. We will now return the places.csv table back to QGIS. Click on Create a layer from Delimited Text file and the dialog box will come up. Browse to where the places.csv file is and load it into QGIS.
5

5.       Put the proper coordinate reference system
5

6. You now have two identical spatial layers. Change the name of the new layer to placescsv so you don’t mix up the two. Remove the first layer –places.
7

7. To carry out the Selection by Attributes, we will need to build a query. Click on the Layer on the main menu, scroll down and select Query.
8

8. Our selection is “Building_col” = ‘blue’'. Double click on the field to be queried (Building_col), choose an operator (=) and take the value (blue) you are querying for. The message box gives the result.
9

9. Right Click on the layer- placescsv and open attribute table to view the rows selected from the Query.
10

Hope you enjoyed the post. Feel free to start practicing and send your comments.

Friday 24 April 2015

Joining attribute data from related tables using QGIS

Our post today will show you how to join the attributes from one table to the attribute table  of a layer on a map using QGIS. To create a join of both tables, an identical field must exist between them, in other words, a relationship must exist between them.

Tables are a very important form of storage in GIS. Attribute (that is descriptive) data on a spatial object are usually kept in tabular form.
Below is our table containing data from the results of a building survey done on these points in the Ibadan municipality. the table is stored in comma seperated values .csv format.


Secondly, let us look below at a registered image of Ibadan municipality where we can clearly see our points (red dots) stored as a layer. All these other attribute data of these points on the table above will need to be joined to the shape file on the map.


Click on the link  Joining tables and follow the steps.

Hope you are practicing already. Feel free to send us your feedback.

Joining data between related attribute tables using Arcmap 10.2

In our previous post, we did this process using QGIS and we hope you have started practicing. From the feedback, some commentators requested for sample data to be able to also follow the processes.
We have provided sample data on our resources page so you can go there and download the files.

 Overview
Joining attribute data between related tables. Note that the two attribute tables should share a relationship with each other, there must be an identical field.  

Task 
  Our task today is to join the attributes from building repair survey table to the point feature-places on the map. We have two sets of data. Our point feature file on the map called places.shp and our building repair survey results on table in csv format. Note that ArcMap loads table data in csv and tab delimited text formats.

Procedure
1. Let us have a look at our data. The places layer is represented as red dots on the map while the building repair survey is a table. You can see them in the table of contents. 


2. Let us inspect the attribute tables we intend to join. Right Click the places layer>open attribute table. You will notice there is not much data to go by. Take note of the Id field.
2

3. Right click on the building repair table >open attribute table. You will notice it has a field called ID too. You will notice all the other data  taken during the survey.

  
4. To execute the join, right click on the places layer>Join and Relates>Join 


4

5. A Join Data dialog box will open up. Make sure you select the identical fields on both tables to base the Join on. 

5

6. To inspect the Join, Right click on places layer in the table of contents>open attribute table. Notice both tables are joined now. The original places attribute table is to the left.


Hope you are already practicing. Don’t forget to get your sample data from the resources page

Thursday 23 April 2015

Digitizing polygon or area features on a raster image using Arcmap 10.2

Polygon or Area features are those that have the same starting and end point.

In this post, we will show the following-

- digitize area features on a raster image

- create polygon shape files in arcmap 10.2

Click on link - digitize polygon features using arcmap 10.2 and watch the video presentation.


Start digitizing folks, send your feedback and comments

Digitizing line features on a raster image using Arcmap 10.2

Line features are those features that have the a different starting point and endpoint.

In this post, we will show you
-  how to digitize line features on a raster image using Arcmap 10.2.
- create shape files that are linear.

Click on this link - Digitizing line features on a raster image  to watch the video presentation.


hope you will start practicing too. we are waiting for your feedback and comments.

Wednesday 22 April 2015

Digitizing point features on a raster image using Arcmap 10.2

This post will demonstrate how to digitize point features on a raster image using arcmap 10.2.
Point features on our raster image are schools, churches, dispensary.


Click on this link to watch the video digitizing point features on a raster image using arcmap 10.2


Feel free to send us a feedback, it is always welcome

Tuesday 21 April 2015

Georeferencing a raster image using ArcMap 10.2


We have in an earlier post dealt with doing some georeferencing in QGIS. This time around, using Esri ArcMap, we will georeference a scanned or rasterized jpeg image of a quarter degree sheet 1:50,000 SHEET 261 (Ibadan NE) using the WGS84 geographic coordinate system.


Tips
  • Make sure the scanned or raster image is in your working folder in the C: drive.
  • Assign a geographical coordinate system to the layer in the Table of Contents before bringing in the image for georeferencing.
  • Its better to allow the system build pyramids when adding the image, so click yes when prompted.
As earlier noted, there are other things which may only be learnt when the process is practically carried out by the viewer. That's why we like to hear from you and shine light on those grey areas.
Watch the tutorial video carefully as it tries to make the process as simple as possible. Click this link for the video- https://drive.google.com/file/d/0B8z8JZ83pZMaaUc4RGY2empmaXc/view?usp=sharing


Note that a left mouse click is indicated by the red burst of light at the tip of the mouse pointer, while a yellow burst indicates a right mouse click.

Esri 60 day trial for ArcMap and ArcGIS Pro- A window of GIS opportunity

After our post on Georeferencing in QGIS, we received a couple of feedbacks by core Esri fans. In their feedbacks, they brought up the fact that since for the mean time the popular applications of ArcGIS and MapInfo still held sway in Nigeria, I should also put up demos on ArcGIS as this would enable a level playing ground for readers to examine both applications.


So the more pertinent question? How can I lay my hands on ArcGIS software to practice the lessons without having to purchase a pirated copy? I get that question from a lot of students and graduates. Well it is simple but it comes with a price tag, yes.


Esri has made available free download of a single license edition of ArcInfo and ArcMap or now called Arcmap and ArcGIS Pro- on its international website but before you shout hurray, here comes the price tag. It is only a 60 day free trial version!! Don’t despair because for any serious minded person, believe me, two months and a dedicated use of online resources can make a big difference in your proficiency in the use of ArcGIS software. You can always proceed in the bliss of QGIS when the trial is over but with the confidence that if challenged with ArcGIS, you won’t wither.
let us remember that the problem with most of us is that we do not adhere to a dedicated software study plan. Instead we leave it to the vagaries of time. Working with a trial software demands that one should make the best possible use of it in the trial period. I have watched with sadness as students use free school wifi to download gigabytes of films and TV series instead of enriching their knowledge of IT, especially professional softwares that will enhance their skill base. So will you blame the school when computer graduates cannot write ordinary html. Javascript etc?
Back to the topic at hand. For the serious minded ones, please follow the steps to download Esri ArcGIS to your laptop or desktop. This are outlined in the link below
https://www.dropbox.com/s/rm6phhhw1cbj0c6/Downloading%2060day%20Free%20trial%20of%20ArcMap%20and%20ArcGIS%20Pro.docx?dl=0
Note the following hardware and software requirements-


Hope you are already downloading as the next few posts will deal on working with ArcGIS.
Am expecting your feedbacks folks. Just go to the feedback page and roll them in.

Digitizing point, line and polygon features into shape files QGIS


This is a continuation of our QGIS series. We started with Georeferencing (See previous post ‘Georeferencing a raster image using QGIS’) and today we will demonstrate how to digitize a raster image to create point, line and polygon shape files.


Watch and follow the video lessons carefully and send any questions, comments or observations through our feedback page. I must chip in that it is quite tasking to show the process of digitizing offsite, but we hope it is made as simple as possible. Sorry, we couldn’t add sound as this would make the video too heavy to embed, we are working on that technicality.


Tips
  • Mouse Right Click on the Layer when you want to Open the attribute table
  • Make sure the layer you are creating and the raster image have the same spatial reference. Note how the spatial reference was changed in the video – ‘Digitizing polygon features’.
  • The ID field on the attribute table serves as index key to join database or tables.
  • Right click when u finish tracing a feature so the table to fill will pop up.
  • To delete the trace, open the attribute table, select it and use the trash bin icon to delete it.
Point features -https://drive.google.com/file/d/0B8z8JZ83pZMaTnlyT0kzTUtSOVE/view?usp=sharing
Line features https://drive.google.com/file/d/0B8z8JZ83pZMabVJLekEwQTRfR1E/view?usp=sharing
Polygon features https://drive.google.com/file/d/0B8z8JZ83pZMaT2p2OW9fQ0RBZ1U/view?usp=sharing


Hope you have started practicing yourself. remember to feel  free to comment.

The recreational User and the GPS receiver


Global Positioning System (GPS) technology is a satellite based system which was primarily set up to ascertain the geographic position and assist in navigation from one place to another.
Previously, GPS receivers were seen as tools for the surveyor until the popularity of the car GPS changed that perception. The moment GPS trackers started becoming a rave, other recreational applications of this tool became very evident.
Hence we decided to post up some recreational uses of the GPS receiver so as to stimulate interest in them for in our local market.


Trekking, Jogging and Hiking - Many of us know the feeling we get after a good hiking trip or early morning jog or trek. It does wonders for the soul and body, keeping one in shape-body and mind. Well, strapping a GPS receiver along can also add more fun by allowing you to gather some statistics about your regular walk namely, your distance covered, elevation model of the terrain, time taken to cover the distance amongst others. You can also plot this on a map and compare your different routes over time.


 Geo-caching- this recreational use was developed by users some years back. Geo-caching involves documenting and sharing geographic coordinates of different Points of Interest and then tasking each other to find these spots. The activity became so popular that GPS manufacturers started to add a Geo-caching menu to their devices and softwares.


 Car GPS- By far the most popular recreational use in the world. Motorist in most countries now use the car GPS to navigate addresses within the city and even countries. By the broad term navigation, I mean things like, choosing the best routes, information on traffic and road repairs. The biggest limitation for expansion in that area locally is our over-generalized post code system, poor road network information and poor attitude to data generation.
  
Adventure- Using the GPS receiver on adventure trips is also a growing recreational niche. Users are able to document onto the internet real time the spatial and non-spatial character of their favourite historical sites, cultural centres and other adventure based themes to an audience continents away.
As the niche of recreational users grow, so also are the manufacturers adapting to the needs of this all important market. Recent versions of even mid-range GPS receivers now have features only seen before in high grade GNSS devices. Inbuilt digital cameras, online connectivity, satellite imagery download, custom maps and Bluetooth capability. The handhelds are lighter and are more aesthetic in body design, touchscreen and even possess near field wireless communication protocols.
On the technical side, recent technological advancements have produced recreational GPS receiver units with far less error rates than before, thereby giving the users almost accurate locational data. Faster processing chips make them to locate and track satellites much faster than before, making them much easier to use on the go.


You can give us a feedback for more information on this topic. We will be delighted to hear from you.

Sunday 19 April 2015

Downloading data from the handheld GPS receiver using DNRGPS software


Downloading data from the GPS after use on the field can be a very fulfilling task. After sweating it out to meticulously collect spatial and non-spatial data on the field, it is quite relaxing to be able to view, process and file away the data for future work.
Most GPS receivers today have proprietary download software, such as Basecamp for Garmin and Vantage Point for Magellan. I have used a couple of them and found that converting GPS data from the format in the GPS – (usually in the GPS Xchange Format *.Gpx) to other formats can be tasking without the right tools.
So a few years ago I discovered a powerful non-proprietary middle man known then as the DNR GARMIN. DNR GARMIN is a product of the Department of Natural Resources, Minnesota and then could only work with Garmin receivers. However with subsequent versions, of which the DNR GPS 6.0 series is the latest, it is adapted to other brands of receivers,as long as the native format of the data is stored as GPX format. DNR GPS is free and has a download size of about 40mb.
DNRGPS will do the following for us in this post-
  • Conversion of GPS data to Spreadsheet form is much easier and direct using the Text Tab delimited format *.txt;
  • Converting GPS data to projected and/or unprojected .shp shape files allowing one to create features in both ArcGIS and QGIS seamlessly.
The GPS data for the tutorial is downloaded from a Garmin Dakota 10 and are waypoints. The Garmin Dakota comes with a downloading cable with a USB port.
Click the icon below to download the tutorial and follow the process (same process can be used for routes and track features)


Saturday 18 April 2015

Georeferencing a raster image in QGIS


Georeferencing basically implies the registration of a raster image in its proper location on the surface of the earth. Practically, its just registering to a GIS the image's geographical control points.
The link below takes you to a video presentation of how to georeference a raster image using QGIS
feel free to send your comments.

QGIS SERIES- MAKING GIS AFFORDABLE?


The QGIS (formerly known as Quantum GIS) platform is an open source GIS platform run by contributors from all over the world. Before the advent of QGIS, similar GiS software packages have been proprietary like MapInfo and Esri ArcGIS. These proprietary packages are expensive and mostly were targeted at corporate users. If the Americans and Europeans mourn about the cost of acquiring these proprietary softwares then we in Nigeria and Africa as a whole are just about at our wits end.

The long term effect of these inaccessibility to affordable GIS software packages has been a software market awash with faulty, half complete, unstable and pirated copies of ArcGIS and Mapinfo. Of course, one should forget the calm group that always managing through on trial versions.

Suffice to say QGIS on the scene  and for free naira is a cool relief. And here comes the catch, we hope to help in making it as popular and useful on the scene as ArcGIS and MapInfo has been for years.

We intend to be posting basic tips on how to use QGIS and the plugins.  QGIS statement is clear, you don’t have to pay so much to become a GIS user. We start this series with a presentation on how to georeference a raster  image with QGIS  using the 2.8 version.why georeferencing? Most times in our clime her, the first thing most people want to know is how to georeference their raster images so as digitize the features into vectors.

QGIS 2.8 is a free application downloadable from the web. Just google ‘download QGIS 2.8′ on your browser.

If you are a user of QGIS, what do you think? we welcome your feedback. Just go to our Feedback page and fill the form.

Friday 17 April 2015

Comparing the level of accuracy of some GPS Enabled devices against the handheld GPS Receiver unit

Often times when I conduct trainings I get asked the question - ‘since our phones have GPS, why the need for this device?’ Over the years, I have consistently done this comparison test many times in the field in order to be sure I was still in tune with reality as technology improves every day.

 What is my objective- To find out how accurate GPS enabled smartphones outfitted with location tracking software could be against the regular handheld GPS receiver unit?

My tools of the trade – a) a Blackberry Z10 running on Google AppSheet mobile location tracking app called ZipStore b) An IPhone running the ESRI proprietary ArcGIS Collector mobile App c) Garmin Dakota 20.
I wasn’t under any presumptions which was the best, so I went out quite sure the Garmin Dakota will better my GPS Enabled devices but the real question was how close or wide the margin will be for these smartphone devices.

Weather conditions- the sky was clear and marked a perfect day for a good mapping experience.

Methodology- at each location, I take the geographic coordinates of that point with each of the devices. The reading is taken on the same spot with each of the devices so there will be a sound basis for comparison. The locations chosen for the mapping have identifiable landmarks, are narrower than wide giving just enough room and margin to highlight the inaccuracies. Each device readings was then downloaded into google maps engine for visualization.

Results – See the embedded google image
Many of the points (shown as red markers) from the ZipStore app hosted on the blackberry Z10 fell off the mark into rather generalized positions. Surprisingly, Points captured using ESRI Collector (show in dark green actually showed a very fair degree of accuracy). While the points captured with the Garmin Dakota 20 when viewed on the imagery showed a near perfect match with the real locations, allowing it to basically serve as a control.

Conclusion- The handheld GPS gave a best showing as expected but the Esri Collector gave a great showing of itself, even rivaling the handheld at a good number of the locations. Esri Collector used base maps downloaded from ArcGIS Online while ZipStore used Bing maps.

Constraints- Most of the Smart phone location apps work with telecom networks for data as storage is cloud based. At location to3, Zip store on the Blackberry Z10 couldn’t acquire location while the Esri Collector started from point to3 downloads and couldn’t participate at to2 and to1 due to slow upload of the base map.

Hope u enjoyed the post, we love your comments.

Thursday 16 April 2015

Unravelling the common myths spoken about the handheld GPS receiver units


I have been using, selling handheld GPS receivers and training people from many different field and disciplines on how to use them for close to ten years now.Since my first encounter with the GPS many years ago, the handheld GPS receiver unit has always held a technological fascination for me. Even back then before the mobile rush, there was something extra special about been able to use technology on the go. I have come across several comments on these devices and I decided to share some of the most commonly spoken views and impressions.
Number one – Seems its expensive!!
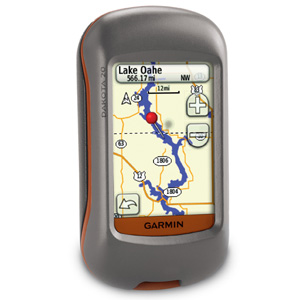
Nowadays, a good mid-range handheld GPS receiver is just as expensive and portable as a mid-range price smart phone. The cheapest Garmin Dakota will easily go for between 100 to 150 dollars in the retail store. An outdoor mapping enthusiasts can save up and purchase this, and mind you, they last far longer than your mobile phones can!
Number Two- I can always use my smart phone inbuilt GPS
This is one of the fastest selling myths.
Firstly, the handheld GPS receiver unit comes with a specialized chipset and processor (SIRF) dedicated to tracking and getting signals or GPS fix from GPS satellites. These devices were built for this singular purposes. On the other hand, your smart phones come fitted for generalized location tracking. Yes I agree they can come in handy but only if supported by specialized location software. Your guess is as good as mine of how many buffs out there will download ArcGIS collector or IDK into their iPad or iPhone? Mapping has its tools, smart phone GPS applications are not designed to map anything more than point features and navigation. They are tailored to the extra specs market not the hard nose recreational user who wants to hike and download tracks.
Secondly, the handheld was designed to manage energy and the demand placed on it by always looking for satellite signals and calculating positions. Most handhelds can last a full day of mapping on a set of AA batteries. A smartphone would be stretched to limit on demand on its battery by such a drain.
Lastly, the smartphone was not designed for rugged outdoor work that you require of your handheld GPS receiver.
 Number Three- I used it only once in a while and that’s it! It goes in the box for another two years!
This tendency is what I will call the facts gone wrong. From my wide experience, many people tend to abandon the handheld GPS receiver once the objective of getting them is achieved, usually this is an office project or training session or fad to keep up with. A handheld GPS receiver can be so much fun to play with if one begins to get creative with it both at work and at home. A simple trekking exercise in the morning with it can help one know his or her usual route and real distance covered. Same also goes for time and the elevation profile of the trek.
We will post that up over the next few days.
 Number Four-I will need some form of advanced training to know how to use it.
Another facts gone haywire. Learning how to use a GPS to do basic functions really is not that expensive nor time consuming. Yes I agree, there are not many trainers out there but we are throwing up a programme soon for outdoor enthusiasts to learn the pros and cons, to help the users achieve a better accuracy and a more credible data for optimal use. We are currently working on stringing up some tips on that, but we want it to be direct feedback. So send in your comments on learning challenges with the handheld GPS and we should be able to give you some answers.
 Number Five- Can I use it to locate my parcel of land and measure the size?
I always remind people- if you are not a trained surveyor, no need to try to be one overnight. Really, with adequate minimal training, one can navigate to that long lost parcel of land and in addition, measure the area and perimeter using a mapping grade handheld GPS receiver unit. Note that the level of accuracy will differ from that of modern high tech survey equipment designed for less than 1m accuracy. We will put up about types, causes of error and how to correct for these errors in a GPS.

Hope you enjoyed the short piece. Let’s have your comments please

Selection by Attributes- Querying Attribute data in a GIS


Attribute data can be defined as non-spatial data that describes the spatial object or phenomena. Matching spatial data with attribute data is a principal part of a Geographic Information System (G.I.S). 

For this tutorial, we use a sample of spatial and attribute data gotten from mapping of Telecom masts. The spatial data made up of the X and Y coordinates of the Telecom masts is stored in the shape file .shp format while the non-spatial data or attributes are in a .csv table. The table contains columns and rows attributed with information about the Telecom masts surveyed- Owner, Height above ground, Mast Id no and Pt No. The intention of this post is to a query the attributes of the Telecom masts for the number of Telecom masts that are owned by MTN which are over 20m in height above ground.

Performing queries allows us to retrieve valuable information from the data that we captured, processed and assembled. Performing this queries in a GIS allows us to tie location to the result of the query. We shared a link to a document titled ‘Selection by Attributes’ showing the steps taken to execute a typical Selection by Attributes task with ArcMap 10.2. The spatial data in shape file .shp format and Attribute Table in comma separated values .csv format.

Wednesday 15 April 2015

Handheld GPS Receiver Units- an Essential tool for the Mapping enthusiast

Click link to see images of handheld GPS Units


Handheld Global Positioning System (GPS) receivers are GPS enabled devices that are portable and are adapted for mobile and outdoor activity such as hiking, biking and even some utility mapping. Suffice to say that even some professionals still find them handy and accurate to a specification. They come in many brand names, with many specifications but are generally classified by price into low, mid and top range models. They can also be classified by function into mapping grade, biking, hiking and marine.

These devices have seen a massive improvement in their design, hardware and software specifications. Many of the leading brands such as Magellan and Garmin have gone ahead to develop cloud based platforms as well as imagery download capabilities in their mid-priced ranges. In addition, the brands have led aggressive marketing to promote the appeal of these devices to the less professional and recreational users.

Mapping grade handheld GPS devices usually come with four standard functions namely-Waypoint, Route, Track and Navigation. These functions give the user the tools to represent real life features properly as well as find his or her way around. They come with a base map and enables the user to capture points, lines and calculate area features and view on a map. They store the data that is captured on the field, with some mid-priced ranges able to store 1000 units of data outside of the memory card. Basically the degree and sophistication of functions drive the price tag.

My favourite handheld tool for a while had been the Garmin GPSMAP 78s. It has a rugged feel and a good sized screen, but it is now way behind in the trend of things today. I got a Garmin Dakota 20 recently and it sports a larger screen,touchscreen and has an interface that is easier (at least by me) to input data. In everything, best of all is the price because for some of the power it packs, it comes at a low to mid-price range of between 180 to 220 dollars.

Nowadays, top range handheld GPS receivers are bundled with a variety of additional high tech software and hardware capabilities such as inbuilt cameras, health and ergonomic monitors, cloud based connections, internet sharing and so on. They could cost anything from 800 to 1500 dollars.

Handheld GPS devices are outdoor tools so they are made to be rugged, float on water and weather resistant. Some are equipped with marine charts and this is normally indicated in the marketing prose.

One of the great things about handheld GPS is the ability to download your data after working on a trip, hike or even serious professional activities.  Most of them come with downloading USB cables and proprietary interface software. We will choose a later post to talk more about downloading and uploading GPS data.

Hope you have gotten that bit of basic information on handheld GPS receiver units. Let us have your comments please

Next post, we debate the myths and facts behind the Handheld GPS receiver!!!

Tuesday 14 April 2015

My Loch Lomond tour in a Story map


Believe me, i really tried to enjoy myself. I am a history buff and the moment i watched and fell in love with the epic-Brave Heart, i packed vacation bags and headed to see some of the real thing. Funny, its was late autumn and the Scottish hale was getting set for full bloom.

well have a peek at my story, albeit a very small peek.

http://arcg.is/1FONtDP

I hope u enjoy this story till i come back with a serious story.

Monday 13 April 2015

WE GOT THE PAGE FOR YOU!!! DYNAMIC WEB APPLICATION FOR COMPARISON ANALYSIS


In our previous post- ‘Lets Analyze’, we could only supply you all with a static map to do the Comparison analysis on the development of Land Parcels in the cadastral layout.

Due to technical issues, we unable to link with the dynamic web map


We intend to continue next to asking the spatial data about its attributes.

Enjoy the post

Our resources page is up!!!! its a good place to start seeing some technical stuff!

The Resources page is dedicated to sharing valuable technical knowledge on how to work with geospatial data and maps. Here, we highlight processes and also how to manipulate data to give the mapper a better representation for his or her view of reality. We wholeheartedly welcome your contributions and comments. Check out the latest resource available now-
Converting Vector layers in Geography KML From Google Earth to ArcMap Feature class
For my last posting @Mapping is an activity-indoor and outdoor, I enumerated the various choices we have when performing the activity of mapping spatial objects and non-spatial objects. Principally since our focus is on spatial objects and the environment around us, it is better we break right into how satellite imagery data we acquire from the activity of mapping can become useful to us all.

Our area of study is a Cadastral Layout of Landed parcel that have been allocated for development and the objective is to analyze the data available and illustrate the level of development that has taken place in the Landed parcels between the years 2012 and 2015.

Our Data are two forms- 2015 Google imagery of the Cadastral layout showing the Landed Parcels in different levels of development. For purposes of this study, development is rated as fenced, uncompleted or completed building 2) 2012 Open street Map Imagery of the same area in ArcGIS Online.

What did we do  – We digitized the Land Parcels that had shown a form of development (fenced, uncompleted or completed building) on a Jan 2015 Google Imagery of the layout. Click the link below to see dataset on Google maps engine,


Secondly we added digitized Land Parcels on the 2012 Open street Maps in ArcGIS Online to produce a feature layer of Land Parcels that had been developed by 2012. 

Next, We upload the vector layer into ArcGIS online.to do a Compare analysis using a Web application. ,

Here is the result, join us to analyze!!!!

       Zoom in to 250% for best view.
The map on the left are Parcels developed by 2012 while the one on the right are Parcels developed by 2015. 

Its now easy to analyze which new parcels have been developed, though due to the static nature of the map, we cannot get more attributes.


Hope you have enjoyed my post as I enumerate how we can also carry out mapping activity using satellite imagery. I know many of you folks will prefer that but watch out for my next post because there might always be need to see things for yourself outdoors,

Your comments are invited 

Sunday 12 April 2015

Basics Theory of Global Positioning Systems Technology (GPS)


Back to the basic – by popular demand

Mapping is any activity carried out with the intent of collecting credible and accurate data on an object e.g. Building, roads, human genome or phenomenon e.g. buying patterns, smuggling and illegal immigration. To go a step further, spatial mapping is when the geographical coordinates of the object or phenomenon is also taken. In other words, the GPS coordinates!!!!

So what are geographic coordinates ooh!!

Geographic coordinates are the X and Y of any object position on the face of the earth pronto!! X stands for the longitude, Y for the Latitude. The X and Y tells us the unique position of an object on the face of the earth.

How do we now get the X and Y coordinates when mapping? Namely on the field and in the laboratory or on the Workstation even your mobile device!!First Choice? Lets take field mapping first

We deploy a technology called Global Positioning System Technology, GPS for short. The technology works through what we know as GPS Enabled devices. These are common now as almost all telecommunication devices, cars, trains even wristwatches are now GPS Enabled!!!

How do we use these devices?

When we use these devices to map a road for example, we use certain functions that exist in the devices. These functions assist us to get a real life representation of how the road looks. Really, a road doesn’t look like a lamp post, neither does it look like a building!!!

Note: not all GPS Enabled devices have Mapping capability but all have the ability to register the basic X and Y of a location. Devices designed with the objective of mapping are usually labelled as so. For example- Handheld GPS devices, Rugged GPS Enabled Notebooks amongst others.

So what does the GPS technology map? The GPS Enabled devices map what we call features. Features are of three main kinds- Points, Area and Lines.

Second Choice: How do we now get the X and Y coordinates when mapping? When one cannot go out? Mapping can also be an indoor activity lol One cannot map human genome in the garden anyway!!! Lol
Today, we are all familiar with dynamic or internet based maps, satellite imagery and aerial photographs. In a GIS Laboratory or Workstation and with the right tools for analysis and interpretation, certain X and Y coordinates of recognizable locations on the earth surface can be extracted. Note that these remotely sensed datasets must be themselves georeferenced.

Even simpler is your handy google maps engine. Here by simply clicking geocoded locations on the face of the earth, their X and Y coordinates can be extracted For example putting in a search for lagos will generate a marker on the google map engine that contains the X and Y coordinates of Lagos!!!!!!

Go to presentation page on menu bar and click links on presentations titled 'GPS Data' and 'Coordinates&Projections'for greater details

Lets see what we can do with data with address

Let’s take a closer look at population data in this Nigeria.

Surprising trends can pop up when we do! How much or how little do we know about the demographic spread of human beings –male and female in Nigeria? Let’s take a cursory look at the facts based on the 2006 Federal census undertaken by the National Population Commission of Nigeria.

Table showing the human population in Nigeria per State and the FCT (2006 Census)

Name
Male_pop
Female_pop
Total
Abia
1434193
1399806
2833999
Adamawa
1606123
1561978
3168101
Akwa Ibom
2044510
1875698
3920208
Anambra
2174641
2007391
4182032
Bauchi
2426215
2250250
4676465
Bayelsa
902648
800710
1703358
Benue
2164058
2055186
4219244
Borno
2161157
1990036
4151193
Cross River
1492465
1396501
2888966
Delta
2074306
2024085
4098391
Ebonyi
1040984
1132517
2173501
Edo
1640461
1577871
3218332
Ekiti
1212609
1171603
2384212
Enugu
1624202
1633096
3257298
FCT
740489
664712
1405201
Gombe
1230722
1123157
2353879
Imo
2032286
1902613
3934899
Jigawa
2215907
2132742
4348649
Kaduna
3112028
2954534
6066562
Kano
4844128
4539554
9383682
Katsina
2978682
2813896
5792578
Kebbi
1617498
1621130
3238628
Kogi
1691737
1566750
3258487
Kwara
1220581
1150508
2371089
Lagos
4678020
4335513
9013533
Nassarawa
945556
917719
1863275
Niger
2032725
1917524
3950249
Ogun
1847243
1810855
3658098
Ondo
1761263
1679761
3441024
Osun
1740619
1679761
3420380
Oyo
2809840
2781749
5591589
Plateau
1593033
1585679
3178712
Rivers
2710665
2474735
5185400
Sokoto
1872069
1824930
3696999
Taraba
1199849
1100887
2300736
Yobe
1206003
1115588
2321591
Zamfara
1630344
1629502
3259846


Now let’s see this table as geographic information and ask ourselves> where are the most densely populated places in our country? And why are these places densely populated? Is it because of movement of people? Are these movements inspired by economic or security reasons?
Population gradient maps shows ‘Very High’ population density (person per sqm) in Lagos, followed by ‘high’ values in the south-eastern region minus Ebonyi and Enugu States.


All well and good, let’s play a card trick. We overlay the population map over this population density map to see whether high population figure equals high population density
Great!! Looking closely, Kano as an example is has high population and high population density. But look at the south-east, though with high population density, they have low populations suggesting an acute shortage of land. Little wonder, as a region, they have high record of internal migration. (States highlighted by the green line have high pop density and high pop figure.)


Hope you have enjoyed our little show, just demonstrating how table data with addresses can become a good source of planning information. Feel free to comment and ask questions!!


Check out our vector download page for KML file on the South West region of Nigeria, its there for only a limited time!!!!